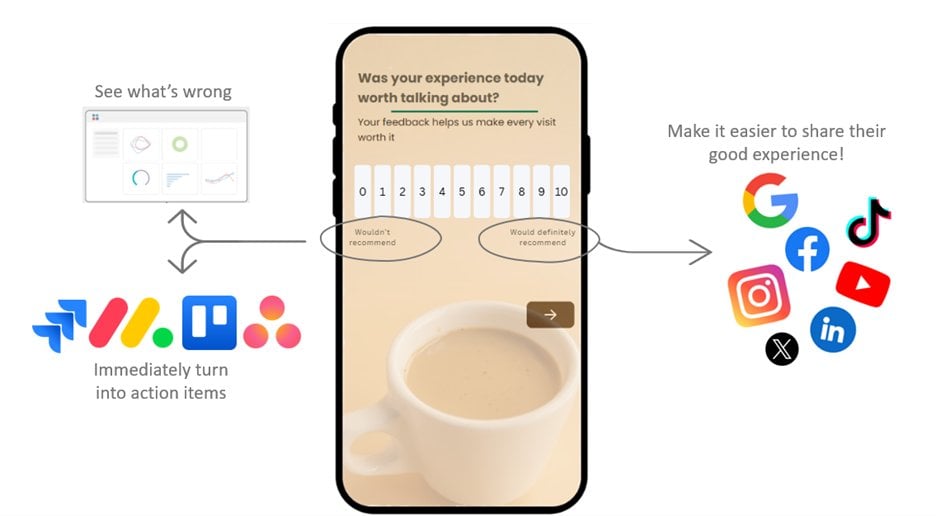
Communicating research findings clearly is just as important as collecting and analyzing the data itself — insights only create value once stakeholders understand them and act on them. Polyeda's custom dashboards are built to streamline reporting and keep stakeholders engaged with the data. Here's how they make research outcomes more accessible and easier to act on.
Tailored Reporting Capabilities
Polyeda's dashboards are engineered to meet the diverse requirements of various research audiences:
- User-Centric Interface: Develop dashboards that offer seamless navigation and accessibility for researchers and stakeholders alike.
- Interactive Data Elements: Integrate dynamic filters and interactive components that enable stakeholders to explore granular data insights.
- Configurable Layouts: Adapt the dashboard presentation to optimize the visualization of data for the specific needs and preferences of target audiences.
Sophisticated Data Visualization
Turning raw data into insights people can actually use takes the right visualization tools:
- Comprehensive Charting Options: Select from a spectrum of chart formats, including bar graphs, pie charts, and line graphs, to present data in the most effective manner.
- Real-Time Data Synchronization: Ensure stakeholders access the most current data through real-time updates that reflect ongoing research developments.
- Customizable Data Filtering: Empower users to manipulate and filter data, facilitating an interactive exploration of key findings and trends.
Enhanced Stakeholder Communication
Polyeda's reporting tools are designed to facilitate transparent and effective communication:
- Shareable Dashboards: Grant stakeholders continuous access to live dashboards for real-time updates and transparency throughout the research cycle.
- Collaborative Annotations: Utilize built-in tools that allow team members to annotate data points, share comments, and engage in discussions directly within the platform.
- Presentation Mode: Transition effortlessly into presentation mode, enabling teams to deliver polished, visually engaging reports during stakeholder meetings.
Conclusion
Polyeda's custom dashboards offer a powerful solution for presenting research insights in a clear, interactive, and effective manner. By providing tailored reporting capabilities, real-time updates, and comprehensive data visualization tools, these dashboards elevate the communication process and ensure stakeholders can fully engage with and act on research findings.